

Project page preview · paper link pending · dataset release on Hugging Face
World2TS
Open Dataset · Real-World Events × Time Series

World2TS: Real-World Event Context for Time-Series Forecasting

A human-reviewed dataset that links diverse time series to relevant real-world events, records when the information became available, and preserves the evidence behind every link.

Zhiding Liu*1 Jiqian Yang*2 Mingyue Cheng†1 Zhi Li†2 Enhong Chen†1

1 State Key Laboratory of Cognitive Intelligence, University of Science and Technology of China, China

2 Shenzhen International Graduate School, Tsinghua University, China

* Equal contribution  ·  † Corresponding authors

01 · Overview

Real-world events linked to relevant time series.

World2TS brings public benchmark collections and newly collected online series into one dataset with shared metadata and validation rules.

Forecasting in the real world is rarely isolated from policy decisions, extreme weather, public-health shifts, operational disruptions, and market news. World2TS links events to the time series they are relevant to, while treating a shared date as an association rather than proof of causation. An LLM proposes and reviews event links, software records and validates the files, and people approve the search plan and final dataset.

  1. 01
    Relevant event linksEach event is linked only to time series for which it is relevant.
  2. 02
    Explicit event timingWe record whether information was available before, during, or after the forecast period.
  3. 03
    Human reviewPeople review the search plan and final event records before release.
World2TS at a glance · real multi-event energy series

See verified events along a real time series.

The 2024 WTI price history moves from right to left. When an event date reaches the center line, its source and summary appear. The markers show association with the series, not proof that an event caused a price movement.

WTI spot price at Cushing · USD/barrel
2024 timeline replay
2024 WTI spot-price timeline with verified events The WTI price history moves left. The center line marks the latest visible observation, and an event marker appears when its date reaches that line. Jan 02 Jan 02 Jan 02 85 70 55 Price history moves left · center line marks the latest visible observation
Jan 02, 2024 0 of 11 events shown
31Datasets
4,179Series
97.1MObservations
1,159Events
56,846Event links
6Domain groups
02 · Framework

LLM proposals, automated searches, and human review.

A real WTI price example shows how World2TS identifies candidate events, searches for evidence, reviews sources, and publishes approved records.

Dataset construction · WTI price example Open vector PDF ↗
World2TS workflow for finding and reviewing events linked to a time series
Workflow. The LLM proposes candidate events and search queries. Software runs each search and records the results. People review the search plan and approve the final event records.
03 · Dataset

One dataset, many sources.

World2TS releases event descriptions and series links for all 31 configurations. Numeric Arrow files are hosted for 26 configurations; the remaining numeric series must be obtained from their original providers under the providers' terms. Browse the data and source notes on Hugging Face ↗

Dataset inventory

NameDomainFrequencySeriesTime spanEvents
31 datasets shownNumbers shown here come from the current World2TS dataset summary

Event coverage by dataset

Average number of linked events per series and the percentage of series with at least one event dated within its observation period.

NameAvg. events / seriesSeries coverage
04 · Analysis

What kinds of events does World2TS capture?

Dataset summaries and case studies show the range of recorded events and the limits of what can be inferred from their timing.

Common event topics by domain

Each word cloud summarizes common event topics for one of six domains. Environmental topics are grouped with weather, and multi-word terms are kept together.

Common event topics · six domainsOpen vector PDF ↗
Domain-specific word clouds for six World2TS domains
Event topics. Each word cloud keeps multi-word event phrases together and summarizes one domain independently.

Time-series and event examples

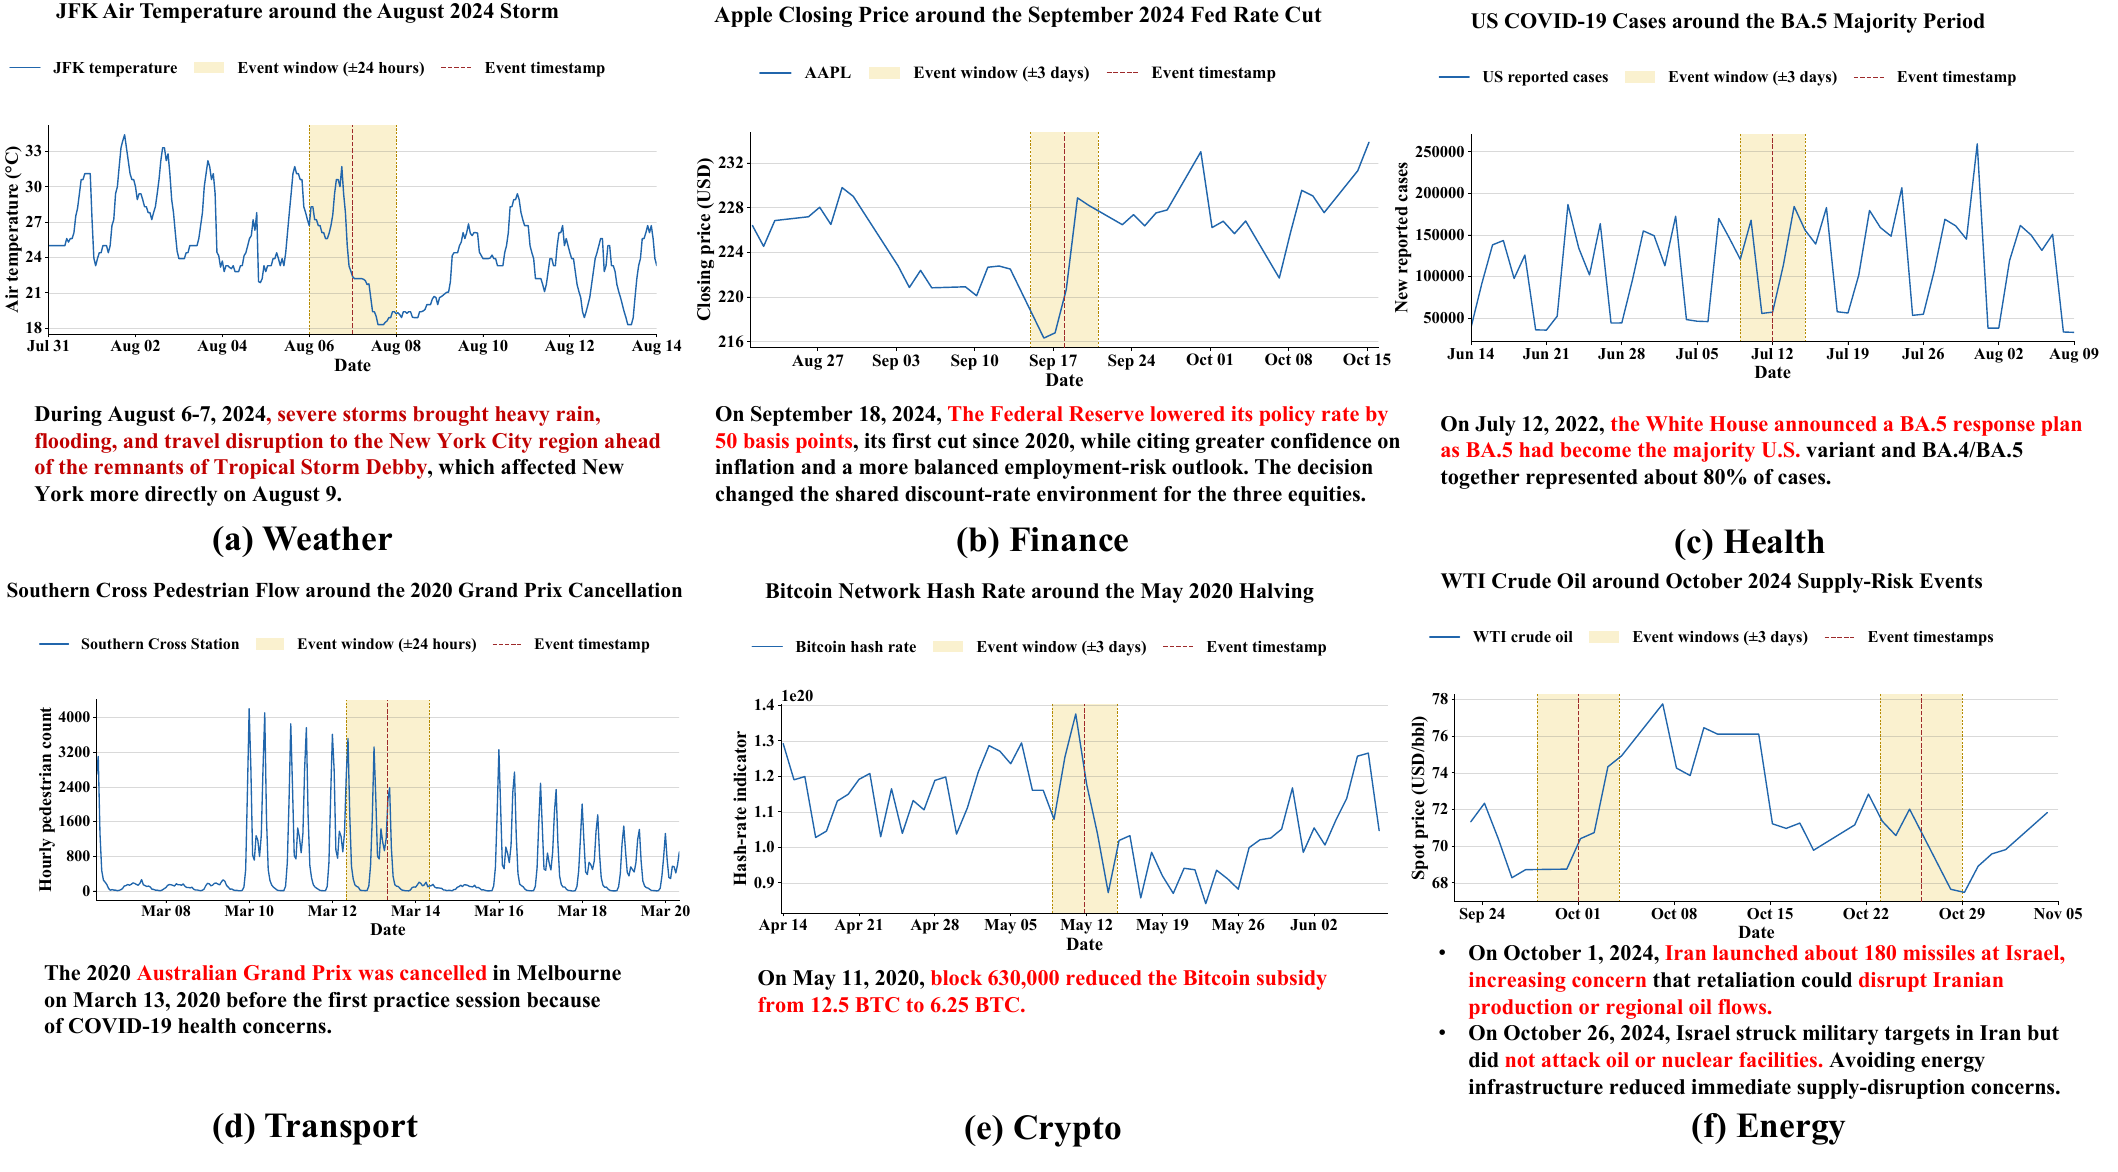
Six examples cover weather, finance, health, transport, crypto, and energy. Highlighted periods show nearby dates, not causal effects.

Case study · six domain examplesOpen vector PDF ↗
Six time-series event case studies across World2TS domains
Examples. Each panel retains the original units, marks the event date and nearby period, and gives an event description relevant to that series.

Changes near recorded events

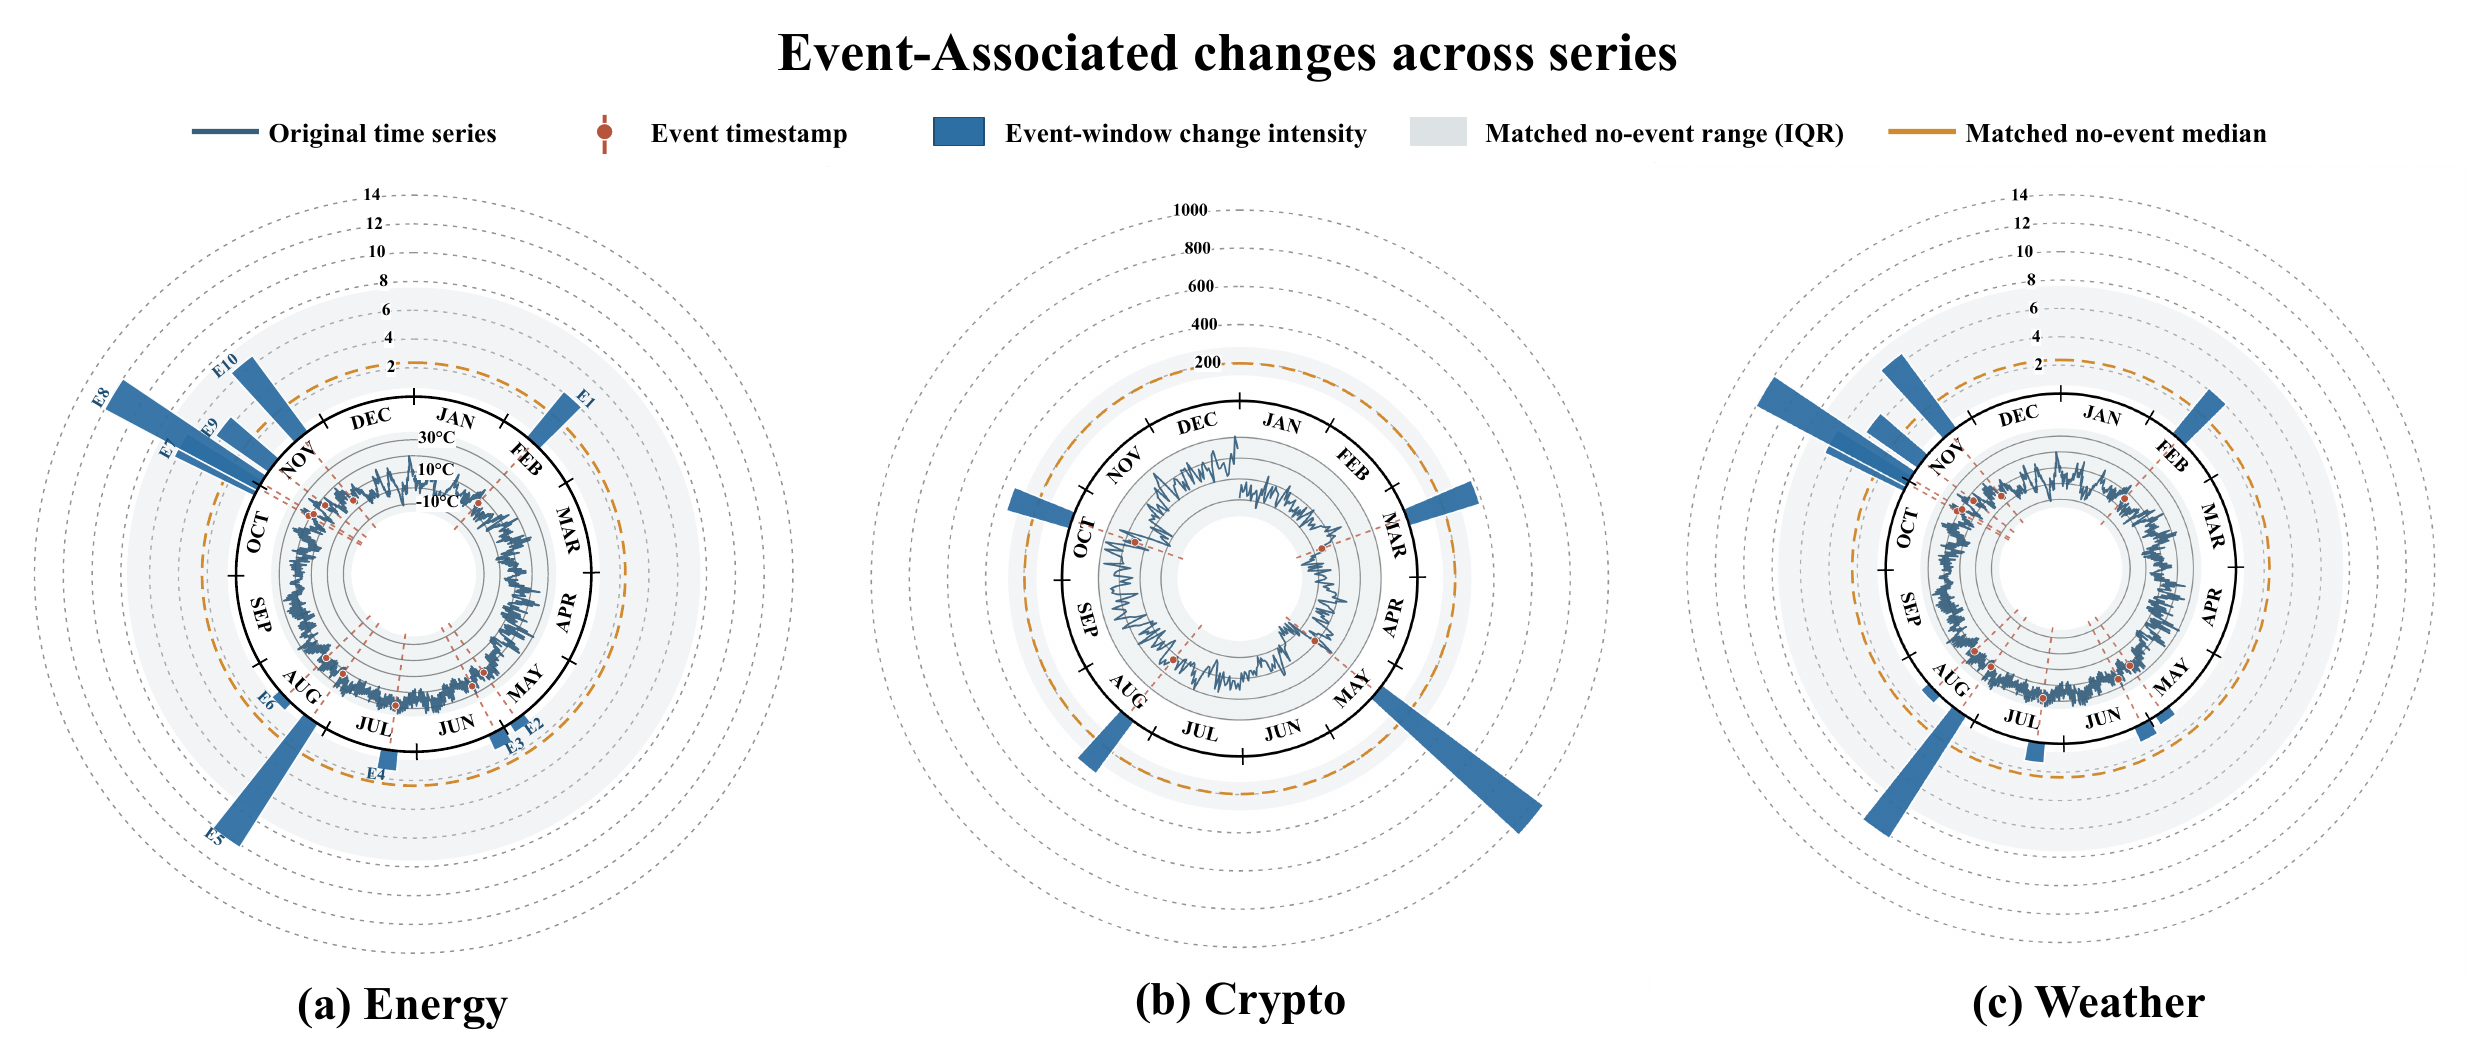
Representative yearly series are aligned at event dates and compared with similar periods from the same series that have no recorded event nearby.

Event periods compared with similar no-event periodsOpen vector PDF ↗
Circular event-associated change comparison for energy, crypto, and weather series
Changes near event dates. The inner ring follows calendar order. Radial bars show the size of the before-and-after change around each event; the gray band and gold line summarize similar periods without a recorded event. These comparisons describe associations and do not establish causality.
05 · Evaluation

Does real-world event context improve forecasting?

The main comparison spans six domains and three forecasting metrics. For each language model, adjacent rows show forecasts with and without World2TS event descriptions.

Main forecasting results

Forecasting errors are reported by domain. For each language model, the Numerical-only row and the W / Context row show what changes when event descriptions are added. Lower is better for every metric.

Forecasting errors by model, input setting, domain, and metric.
Model Input Crypto Transport Energy Weather Health Finance
MAERMSEsMAPE MAERMSEsMAPE MAERMSEsMAPE MAERMSEsMAPE MAERMSEsMAPE MAERMSEsMAPE
Seasonal-7Numerical only 0.29860.396712.41% 0.51481.216653.88% 0.41220.626068.47% 0.44370.523299.05% 0.07420.225513.35% 0.29540.344015.66%
PatchTSTNumerical only 0.27450.358411.26% 0.29420.589045.31% 0.17250.246237.05% 0.29860.377477.57% 0.32310.507654.66% 0.38440.456819.50%
Chronos2Numerical only 0.24860.330410.26% 0.41030.939149.17% 0.29010.441353.89% 0.29810.388871.74% 0.12310.284820.72% 0.21760.285811.13%
GPTNumerical only 0.26200.352111.03% 0.59081.285162.57% 0.31470.492655.95% 0.44670.542488.44% 0.10820.297617.72% 0.18860.237610.17%
W / Context 0.25190.330410.50% 0.54121.196758.22% 0.25860.384249.52% 0.35570.441179.66% 0.09570.283716.16% 0.17610.22419.47%
DeepSeekNumerical only 0.26500.359510.96% 0.60221.281465.22% 0.31450.506753.98% 0.42220.519489.24% 0.07440.246312.35% 0.18560.239810.00%
W / Context 0.24870.334510.28% 0.52121.154658.79% 0.25150.380848.63% 0.36680.471979.00% 0.06800.221812.32% 0.18650.24199.96%
CastFSR-ZeroNumerical only 0.25010.324910.41% 0.44641.024151.94% 0.26280.409948.92% 0.27960.367266.90% 0.12670.325520.94% 0.20810.262810.80%
W / Context 0.24610.320610.21% 0.43880.998753.91% 0.24150.365147.96% 0.28170.364469.57% 0.09040.266915.96% 0.20060.260210.31%
↓ Lower is better for MAE, RMSE and sMAPEBold marks the lowest error in each domain and metric
Forecast examples

Forecast examples across six domains

Six examples compare the observed future values with forecasts based on numerical history alone and forecasts that also receive World2TS event descriptions.

Forecast case study · six domainsOpen vector PDF ↗
Forecast comparison for weather, finance, health, transport, crypto, and energy time series
Forecast comparison. Blue shows the observed future values, orange the numerical-only forecast, and green the forecast with World2TS event descriptions. In every panel, the forecast begins immediately after the displayed history.
Reasoning comparison

How event context changes LLM reasoning

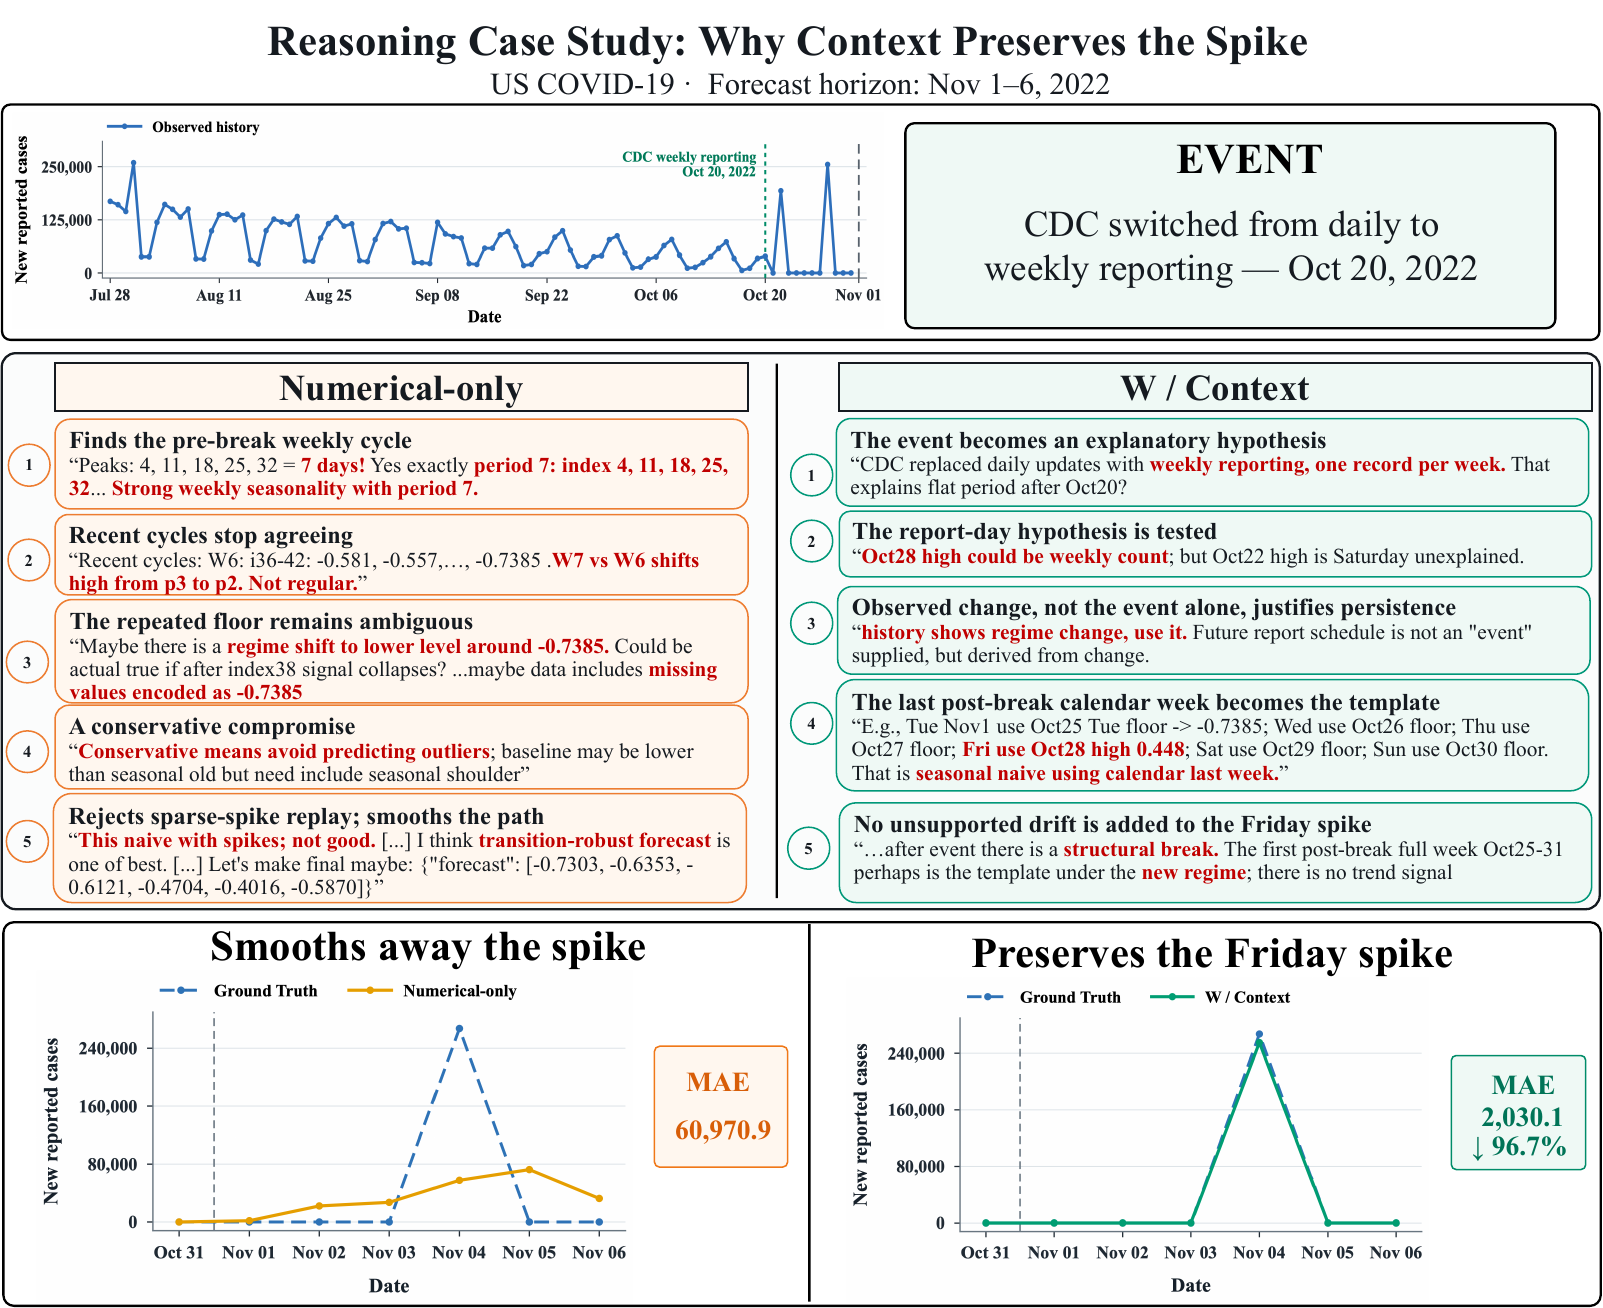
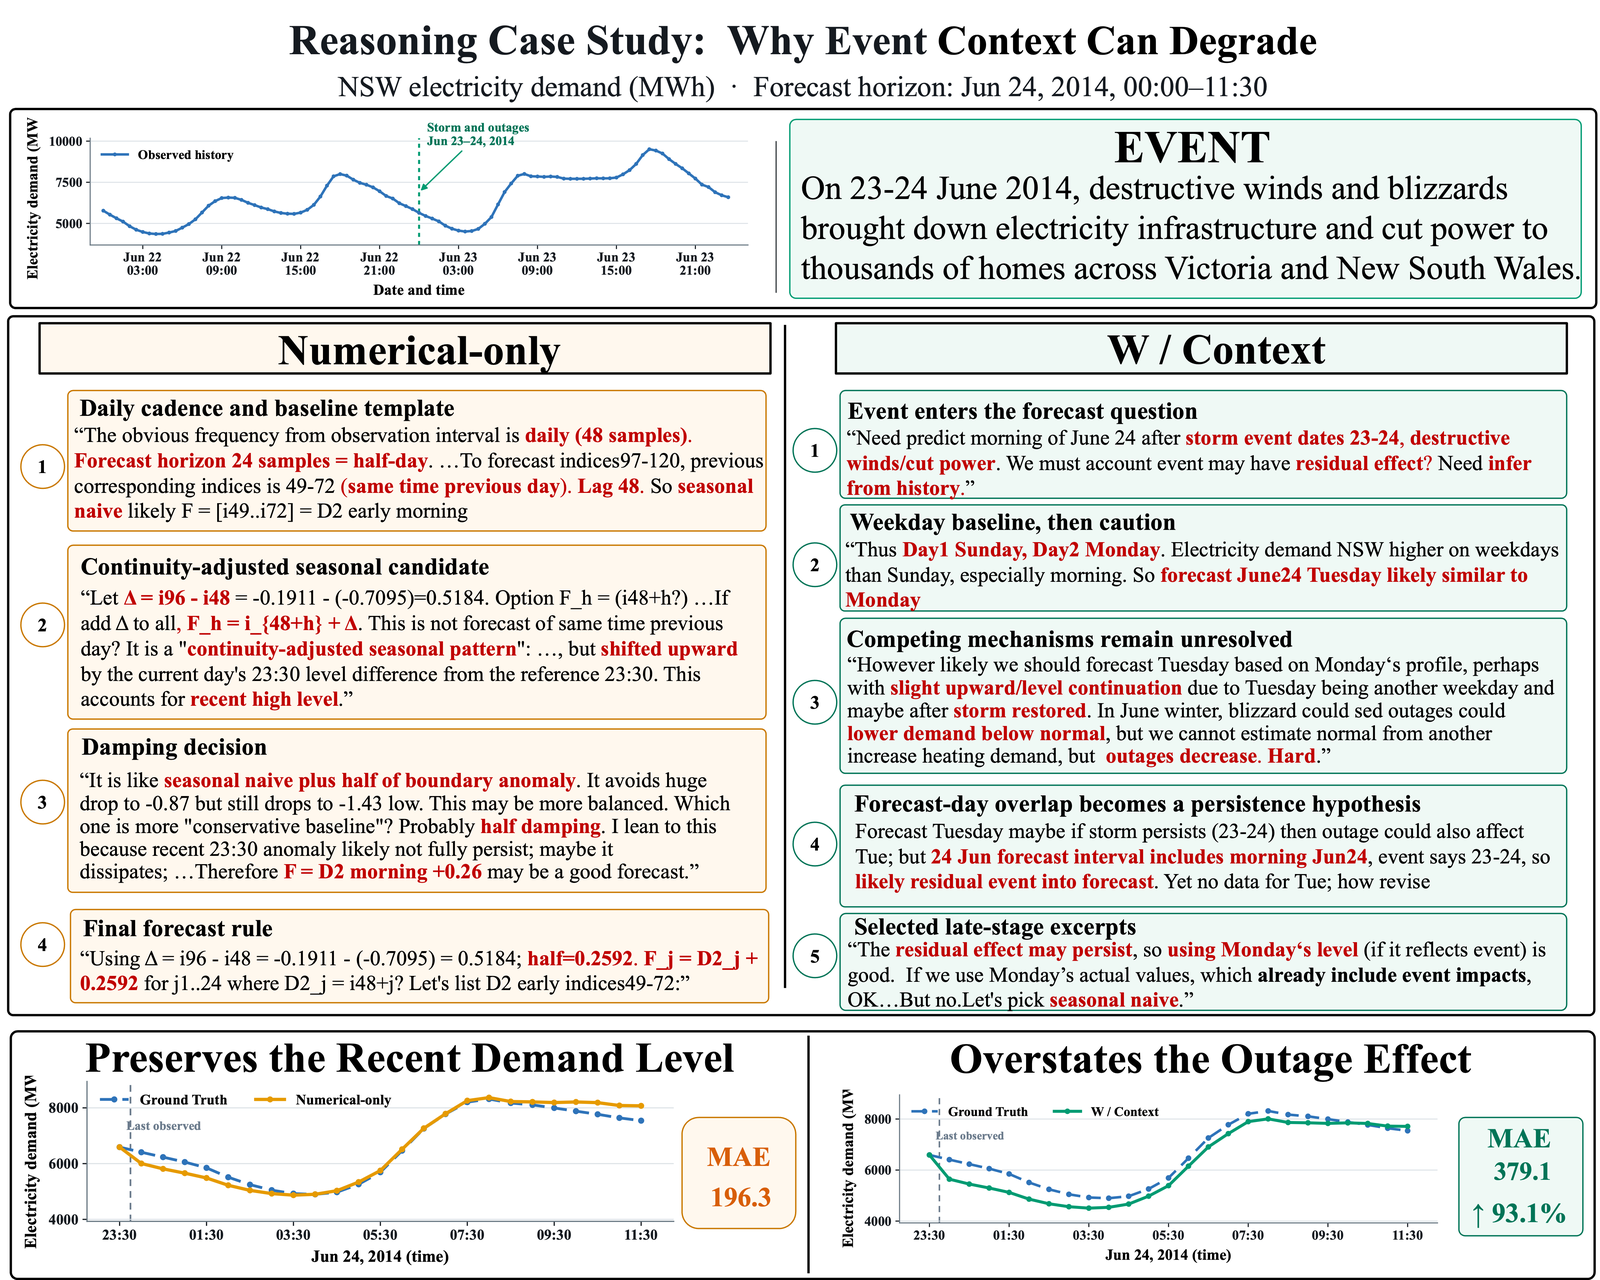
Both examples start from the same numerical history and show how an added event description changes the model’s interpretation and forecast. It helps in the health example but hurts in the energy example.

Health · context explains a change in the reporting schedule

Positive Case
Model reasoning · US COVID-19 reportsOpen vector PDF ↗
Health reasoning trace comparing numerical-only and context-aware forecasts
Positive Case. With context, the model links the floor-and-spike pattern after October 20 to the CDC switch to weekly reporting, repeats the first complete week after the change, and retains the Friday spike.

Energy · context overstates lingering storm effects

Negative Case
Model reasoning · NSW electricity demandOpen full resolution ↗
Energy reasoning trace showing a negative case where event context degrades the forecast
Negative Case. The numerical-only forecast follows the daily pattern and recent demand level. With context, the model assumes that storm and outage effects continue into the forecast period, shifts the forecast downward, and increases MAE by 93.1%.

Each example follows the steps present in the model output. We do not force both reasoning traces into the same template.

06 · Citation

Cite World2TS.

Author information is included below; venue and publication identifiers will be updated after finalization.

@misc{world2ts2026,
  title  = {World2TS: Real-World Event Context for Time-Series Forecasting},
  author = {Liu, Zhiding and Yang, Jiqian and Cheng, Mingyue and Li, Zhi and Chen, Enhong},
  year   = {2026},
  note   = {Dataset and project page}
}